
Time Decay, the Silent Killer.
Time decay is also called theta and is known as one of the options Greeks.
It is the reduction in the value of an option as the time to the expiration date approaches. Let’s review the option value formula.
Market value = Intrinsic Value + Time Value.
The Intrinsic value is the difference between the underlying price and the option strike price.
For example, the stock AAA price is 23€ an option AAA with a strike price at 20€ has an intrinsic value of 3€.
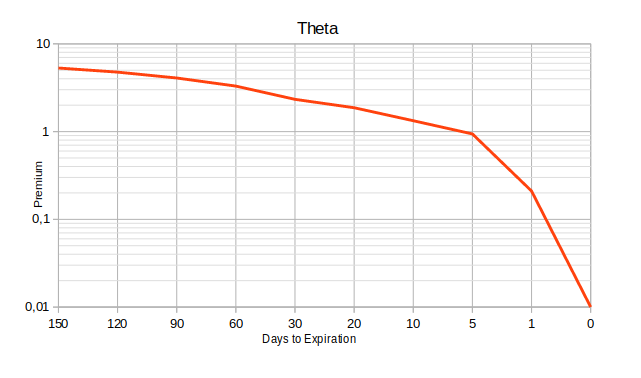
The time value declines or time decay accelerates as the expiration date gets closer because there’s less time for an investor to earn a profit from the option.
The following graph illustrates the time (value) decay acceleration.
What to remember.
- When you buy an option, the time is playing against you. You must buy an option with a distant expiration date. This increases your chances of being right.
- As option writer, you must sell an option with an expiration date close in order to benefit from the time value decay. You are a kind of time seller.
- The at-the-money and out-of-the-money options are more affected by the time decay than the options in-the-money. An ITM option has an intrinsic value (in addition to time value).
- Time decay also accelerates as the options are approaching the last 30 to 60 days of their lifespan.
Funny stuff about decaying…. The option is still losing value when markets are closed (weekend & holidays) 😜.
Statistics.
Let’s review the normal distribution and Gaussian Bell.
A normal distribution is one of underlying assumptions of a lot of statistical procedures. In nature, every outcome that depends on the sum of many independent events will approximate the Gaussian distribution after some time, if respected the assumptions of the Central limit theorem.
Data from physical processes typically produce a normal distribution curve.
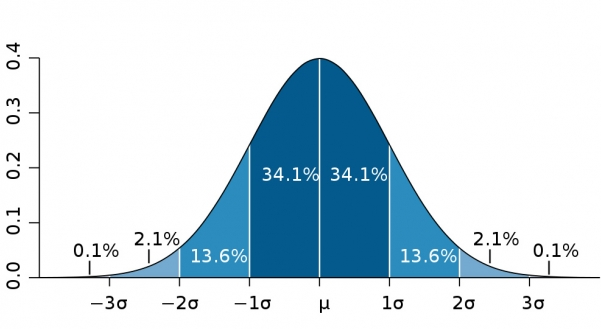
- μ is the mean value,
- σ is the standard deviation.
The properties of a normal distribution are :
- The mean is at the middle (50% of the data are above and 50% of the data are below)
- 68% of the data fall between -1σ and 1σ
- 95% of the data fall between -2σ and 2 σ
- 99.7% of the data fall between -3σ and 3σ
Implied Volatility.
Volatility, in relation to the options market, refers to fluctuation in the market price of the underlying asset. It is a metric for the speed and amount of movement for underlying asset prices. Cognizance of volatility allows investors to better comprehend why option prices behave in certain ways.
Implied volatility is a dynamic figure that changes based on activity in the options marketplace.
- when implied volatility increases, the price of options will increase as well, assuming all other things remain constant.
- When implied volatility decreases the price of options usually decreases.
Option traders often buy or sell premium with the intention of profiting from an increase or decline in market volatility.
Here are six levels of volatility.
- Extremely High: IV Rank between 87 and 100,
- High: IV Rank between 75 and 87,
- Moderately High: IV Rank between 50 and 75,
- Moderately Low: IV Rank between 25 and 50,
- Low: IV Rank between 12 and 25,
- Extremely Low: IV Rank between 0 and 12.
When normal distribution meets Implied Volatility.
The normal distribution curve represents the distribution of a stock price.
Obviously, knowing the probability of the underlying stock finishing within a certain range at expiration is very important when determining what options you want to buy or sell and when figuring out which strategies you want to implement.
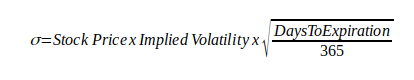
Implied volatility is expressed as a percentage of the stock price, indicating 1 standard deviation move over the course of a year.
=> σ = Implied Volatility
But we usually do not trade options over one year but on the shortest period of time such as 30 days, 60 days, and so on. So can define a more accurate standard deviation using the following formula:
Example.
The current price of the stock AMD is $54.32, the implied volatility is 45% and you want to trade option with 60 days to expiration.

- 68% of the stock quotes should be between $44.41 & $64.23 ([-1σ;1σ]).
- 95% of the stock quotes should be between $34.50 & $74.14 ([-2σ;2σ]).
- 98% of the stock quotes should be between $24.59 & $84.05 ([-3σ;3σ]).
Conclusion.
Implied volatility is based on consensus in the marketplace, it’s not an infallible predictor of stock movement.
Even if it is not 100% accurate, implied volatility can be a useful tool.
This method provides you an estimate, it is not a foolproof rule.
Options Academy articles
I. Let’s talk about options.
II. 4 basic strategies.
III. Advanced strategies.
IV. Ultimate strategies.
V. When volatility, time & statistics meet.
VI. Option management strategies (Part I).
VII. Option management strategies (Part II).
VIII. How I am trading options.
Sources
- The Options Guide,
- tastytrade.com,
- Investopedia,
- The Motley Fool,
- John Hull « Options futures and other derivatives ».
Soyez le premier à commenter